This is Part 2 of a two-part blog post highlighting the cool winter season we’ve generally experience in the Seattle area this year.
For both posts, I am using a ‘seasonal year’ which runs from November 1 through the follow October 31.
Technically, November is late autumn, but snow is not uncommon in the Seattle area in November, and it is generally the beginning of our long winter-spring season, where on any given day it may seem more wintry or springlike during this period. Low temperatures can typically drop into the 30s ˚F and rarely rise above 60 ˚F, and often barely reaching the 50s ˚F.
Days are often cloudy in this period as well in addition to being cool.
Part 1 explore the Accumulated Average Daily Temperature.
Part 2 explores the Average Daily Temperature by day of the seasonal year for the entire period.
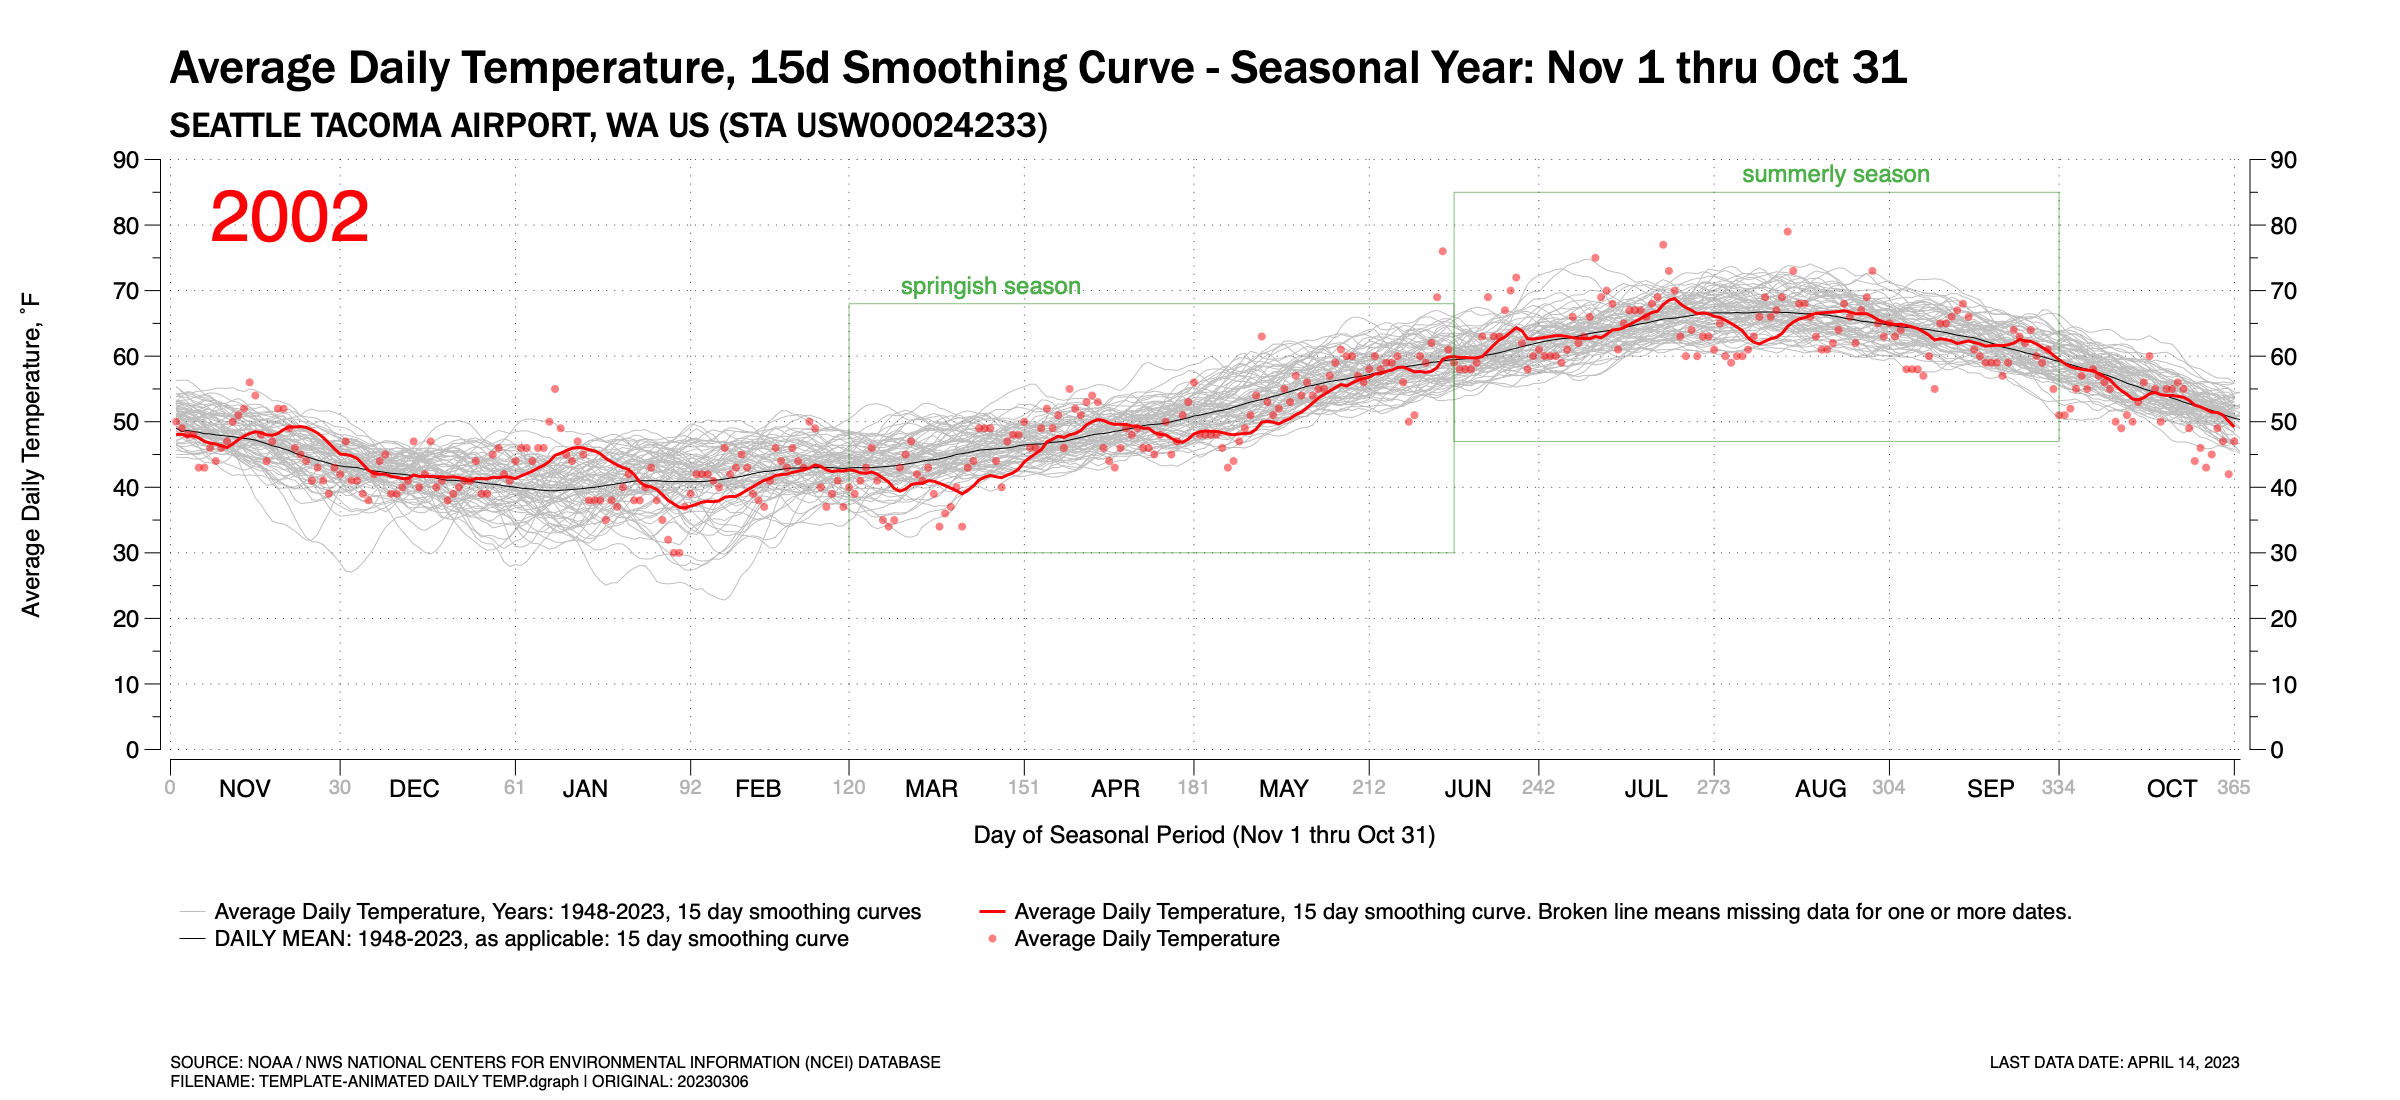
Figure 1 is an animated GIF which pages through the years 1948 through 2023 (to-date) and shows the Average Daily Temperature (ADT) recorded at Seattle Tacoma International Airport. In the background, three basic time-series traces exist: (a) light gray traces of 15-day running averages of the ADT for each year; (b) a red trace showing the 15-day running average of the ADT for the highlighted year; and (c) a dark hairline curve of the 15-day running average for the mean of all years. Individually recorded daily ADTs are show as red points.
The animation highlights the wide year-to-year variability in the ADT as the red highlighted year trace fluctuates across the broader gray traces for each year. Some temporary trends exist though you need to look at them quickly. In the early-mid 1950s, the ADT traces are often in the low half of the temperature band. In the 2010s, the opposite is true. Still, even with this, year-to-year variance fluctuates commonly across the gray temperature traces.
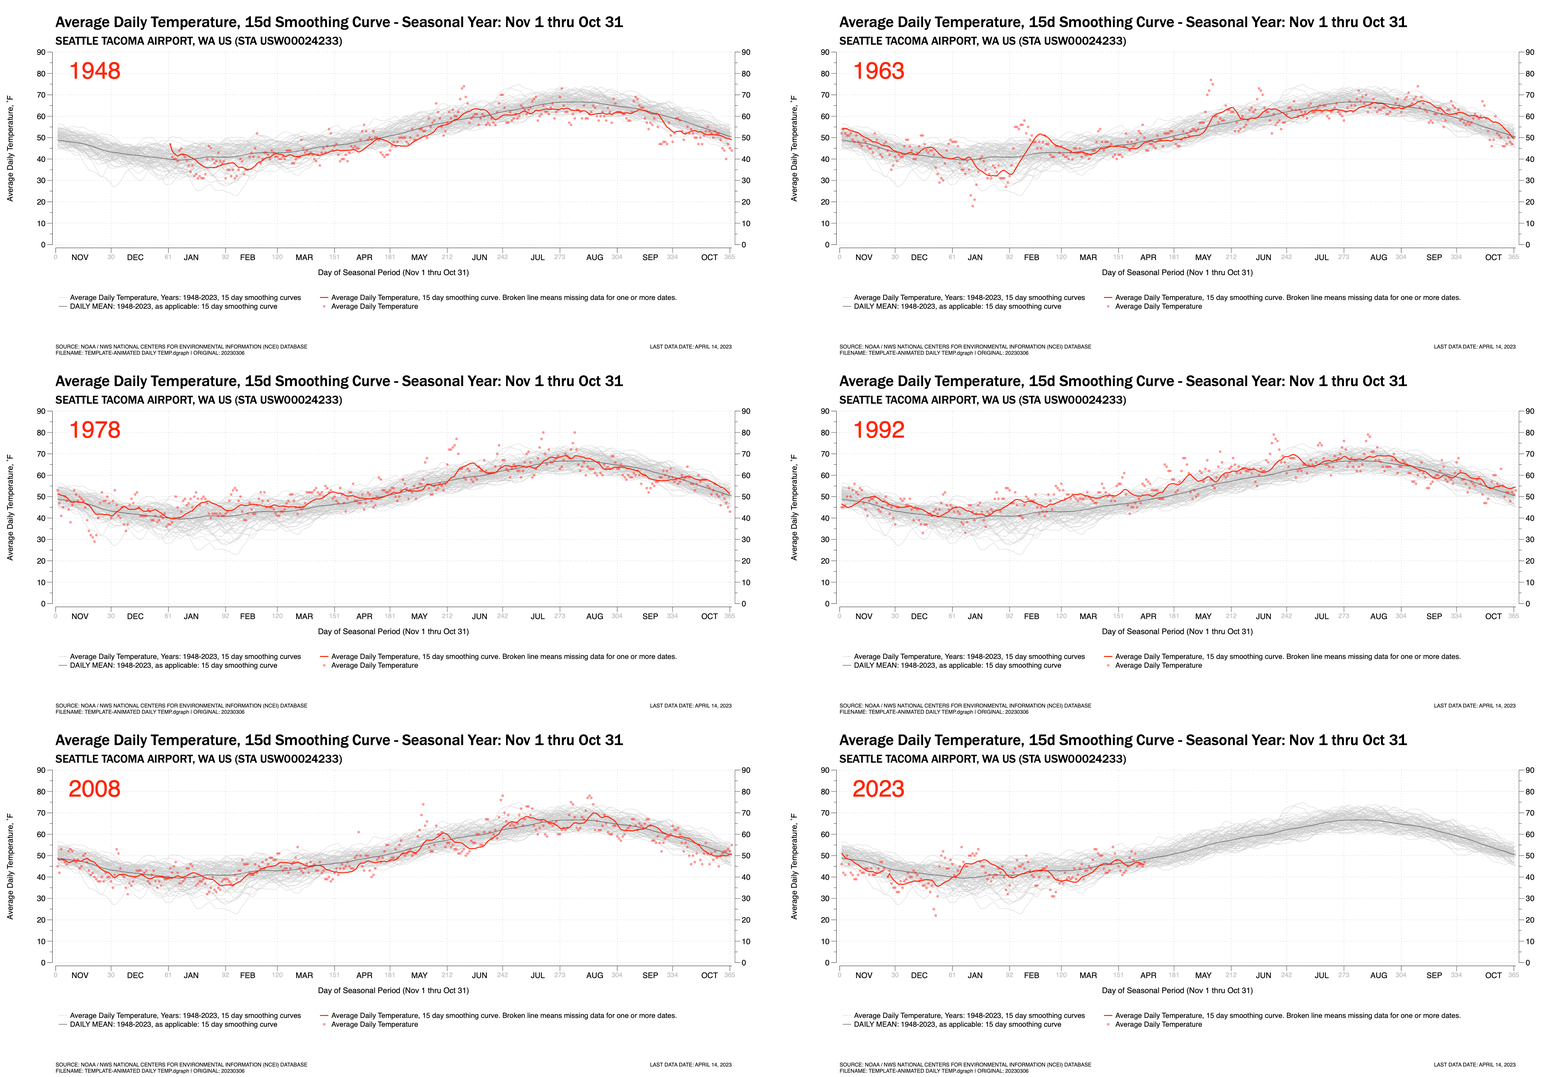
Each highlighted year’s chart is shown in Figure 2. Scroll down to compare. It is easier to compare still images more accurately and studiously. The animation simply shows the wide year-to-year variance.

Figure 1. An animated GIF showing the daily Average Temperature at Seattle-Tacoma International Airport for the years 1948 thru April 2023. Also shown is the 15-day running average and the mean daily temperature for all year, also plotted as a 15-day running average.
Figure 2. Time-Series Plots by Year
Click any chart to enlarge. Hint: Once an annual year shows up, you my be able to navigate using your keyboard’s left and right arrow keys


