On summer's maximum daily temperatures...

I looked at the extreme departures from 30-year normals of the daily average temperatures in my last blog post in late June, 2021. This was right after Seattle and the Pacific Northwest endured record high temperatures for several days.

Today, on the National Weather Service (NWS) site there is a warning of warm temperatures ahead for the next few days. They don’t expect the temperatures in Seattle to exceed the 100˚F mark as it did in late June. But they expect a couple of the days will reach above 90˚F. Other areas in the West to the south and east of Seattle are expected to have temperatures exceed 100˚F over the next few days.

In my book, anything above about 85˚F is hot. Maybe not uncomfortably hot, but it’s certainly starting to hit the unpleasantly hot range for me. I grew up in the Great Lakes Midwest, so hot summers are nothing new. But my most recent 38 summers have mostly been spent in Seattle, a city with generally cooler and more pleasant summers than those in the Midwest. I enjoy those and have become accustomed to those temperatures. I’ve become a heat wimp.

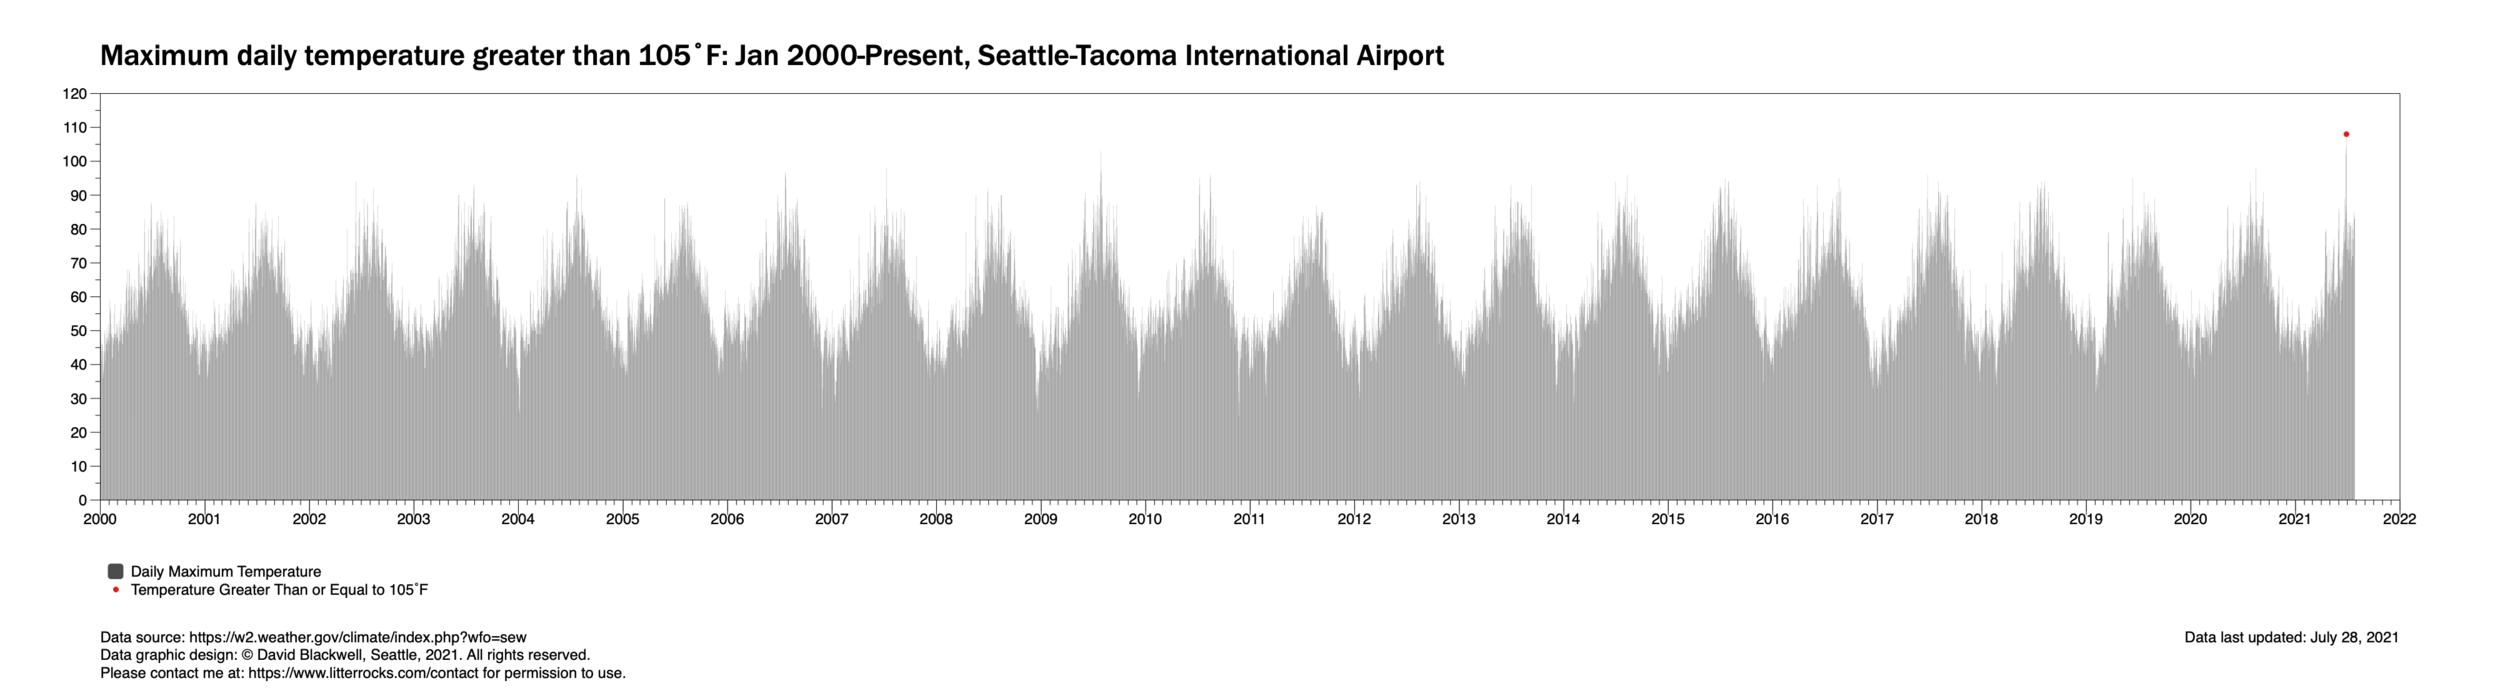
However, though not common, temperatures at 85˚F or greater are not rare in Seattle summers. Here’s a look at several charts depicting days – over a very limited 21 year time scale – where maximum temperatures match or exceed the following thresholds: 85F, 90F, 95F, 100F, and 105F at Seattle-Tacoma International Airport, Seattle’s official NWS site of record.

Click on any image below to expand it. Hint: once you expand the first chart, you can navigate to the others using your “left” and “right” arrow keys on your keyboard.

Departures from normal...

Updated: July 22, 9:30 AM PDT

Departures from normal could apply to a lot of things recently, but I’m speaking here of daily average temperature departures from 30-year normals, as calculated by the National Oceanic and Atmospheric Administration (NOAA) and the National Weather Service (NWS) for Seattle-Tacoma International Airport.

Seattle and the Pacific Northwest is currently undergoing a historic heat wave. The first time-series chart is a bar chart representing every day since January 1, 2000. That is 7850 days up to June 28, 2021, so the bars appear as thin lines. Each bar plots the departure from 30-year daily normals as reported by the NWS. Red bars or lines represent positive numbers (warmer than normal days). Blue bars or lines represent negative numbers (cooler than normal). A 365-day smoothing curve has been applied to the chart.

On Sunday, June 27, I added a series of red data points where the average daily temperature for a given day matched or exceeded 20˚F. I added a series of blue data points where the average daily temperature for a given day matched or fell below -20˚F. The 20˚F limits were arbitrary and chosen to:

  • limit data clutter

  • show only really hot or cold days (for a given day), and

  • because yesterday was extraordinarily hot and was 22˚F warmer than normal for June 26 (and later in the day, added data for June 27, an even hotter and more extreme outlier).

I’ve since added similar data for Monday, June 28

Figure 1. A time-series chart showing daily temperature departures from 30y normal at SeaTac Airport from Jan 1, 2000 thru June 27, 2021.

Updated: July 22, 2021


What I found…

  • Since roughly 2013-14, the trend has been towards slightly warmer days (e.g. 1-3 degrees F).

  • The number of days 20˚F or cooler than normal were four (4). All occurred before 2011.

  • The number of days 20˚F or warmer was ten (10). All but one of the really warm days (for a given date) occurred for this data set after 2016. I added data for June 28 to the chart this morning. The NWS has released preliminary data that it reach 108F, a record, at 5:13 PM. This was 34˚F greater than the normal high for the date, and the daily average temperature was 23 degrees warmer than the 30Y norm for this date. That 23 degrees was actually down from the day before even though the daily high was higher than Sunday’s.

  • Note: there is an extra data element shown here ‘unrelated’ to temperature, For a period from roughly 2014 until mid-2018, SeaTac received roughly 42 inches more of rain than normal. This is more than one year of rain beyond what we normally see. I just had a roof replaced. It got quite mossy over the past 6-7 years.


Figure 1B simply shows a cropped image of Figure 1 to give a clearer picture of what the detail data underlying Figure 1 appears as.

Figure 1B. A sample chart showing more detail than Figure 1 by cropping the timeline to start at January 1, 2019.


Figure 1C is new and focuses in on just data since the start of this year.

Figure 1C. Average Daily Temperature Departures for calendar year 2021.

Updated: July 22, 2021


Table 1 shows the specific dates and temperature departures displayed on the timeline of Figure 1. Table 1 is sorted in chronological order, oldest to most recent. Shaded rows highlight successive days.

departureT.png

Table 1 highlights several things:

  1. Since 2000, very cool days (-20˚F or below normal) for a given date have occurred over a four year span from 2006-10.

  2. These much cooler than normal days typically occurred in late November or December, out darkest months in Seattle.

  3. Since 2000, much warmer than normal days for a given date have occurred over a nearly twelve year span. There are ten (10) of these days. All but one of those days have occurred in the past five years.

  4. The warmer days occur over a range of seasons including mid-Spring to mid-Summer.

  5. About half of the extreme days occur on consecutive days. This makes sense. Weather systems are very large and cam take several days to break patterns.


Histogram

Figure 2 displays a histogram plot of the total population of daily temperature departures from 30Y climatic normals and it shows a normal distribution. I suppose this is to be expected. Climate does change over time, but relatively slowly. A 20 year time span of day-to-day data is unlikely to show highly skewed distributions. This distribution does skew slightly towards higher temperatures.

Figure 2. A histogram of the daily temperature departure distributions.


Box Plot Distributions

A box plot is a statistical tool which can assist with seeing data distributions. It divides data sets into quartiles. It shows the median of the data. If you add whiskers to the plot it can help identify potential outliers in data. A primer on box plots can be found here.

I plotted the same data set as above using a box plot. It includes (as of 6/28/21) 7850 data points. The box plot is shown in Figure 3. You can click on it to expand it.

Figure 3. Box plot showing data distribution of daily temperature departures from normal, Seattle-Tacoma International Airport.

what I found…

  • The NWS reports daily temperature departure in whole numbers or integers. So the data points shown line up directly over discreet ticks along the X-axis.

  • The median temperature departure for all 7850 data points was 1˚F.

  • The mean temperature departure for this 21+ year period was 0.9022 ˚F, up .001˚F after Monday’s record high temperature.

  • The first quartile for all data points occurred at -2˚F.

  • The third quartile occurred at 4˚F.

  • The IQR was 6˚F.

  • The coolest departure was -23˚F.

  • The warmest departure for any given day was 25˚F (6/27/21).

  • The range of data spanned 48˚F

  • The software application [1] that I use for graphics development draws outliers when the data points exceed 1.5X the Inner Quartile Range (IQR) from the median for the data set. The whiskers (or lower and upper adjacent values) are drawn only to the smallest or largest non-outlier. Extreme outliers that are 3X the IQR are drawn as open circles. With 7850 data points to consider with a widely variable data point like daily temperature fluctuations, there are bound to be some outliers to the data. Figure 3 shows three of the most extreme outliers occurred June 26-28, 2021.


Finally, I’ll add a few more box plots showing the same data in slightly different formats. The first of these additional box plots, Figure 4, adds the data points in between the lower and upper adjacent “whiskers” and inside the Interquartile range.

Often, these individual data points are of little concern to the greater picture. But I wanted to show those unfamiliar to box plot diagrams that there are data points between the whiskers on the chart. Essentially, this diagram design is now a strip plot with the IQR and whisker elements of a box plot added as a top layer.

I did two other things:

  • I also added a little ‘noise’ to the data to jitter the values slightly. If I did not do this, all data points would fall on discreet integer tick mark values due to the NWS dataset assigning whole numbers to Temperature Depart data. In essence, most of these 7000+ data points would be stacked on top of each other and be hidden if I did not add ‘noise’ to the data.

  • Second, I turned the color transparency value of the data dots to 15% opacity to help see overlapping data points. There are many, many more data points in the IQR region of the graph and due to the overlapping created by the noise these appear as ovals instead of circles.

I left the outlier layer turned on in Figure 4.

Figure 4. An alternative box plot of daily temperature departure vallues for Seattle-Tacoma International

In Figure 5, I basically plotted the same chart as in Figure 4. However, in Figure 5 I’ve turned off the outlier layer. There are no solid black or unfilled outlier circles shown. But because these points are beyond the left and right chart whiskers, we know them to be outliers.

And I left the outlier date labels for June 26-28. In some ways, this visually enhances the depiction of the outliers, showing more slightly jittered points than the solid or outlined circles do.

Figure 5. Box plot of daily temperature departures.


The past several days, temperatures have risen into the triple digits. These values have been 20-30 degrees higher than normal. I believe it’s been worse in Portland. Places east of the Cascade Range have been hit very hard as well, as has Northern California.

But I live in Seattle, on Capitol Hill, and that is where my focus will be. I plot all sorts of data as a hobby, much like others do crossword puzzles daily. I wanted to compare the elevated daily temperatures we’ve seen recent and plot these along a timeline.

My data is limited. I only have data going back to January 1, 2000, or about 21 years. Of course data exists for SeaTac Airport well before 2000. I even have it downloaded but it requires a lot of post processing to fit my data model. The NOAA/NWS CSV format for that earlier data is significantly different than more recent years. So I’ll plot what I have for now.


Full disclosure: I am not a statistician, applied statistician, meteorologist, nor a climate scientist. I did have a 30+ year engineering career in civil aviation so I am familiar with numbers. And I enjoy looking at data and applying basic statistics to the numbers. But a skilled statistician or professional in the weather field might quibble with some of what I’ve shown here, and they would likely be correct.

I prefer seeing data as it presents itself. I prefer keeping my politics out of what I find and publish. The truth is, I don’t know what significance any thing I might find in the data may have on the larger picture of things. Climate science is not my specialty. I really doubt anything I present on this little blog is not already well known by scientists in the fields of interest, whether climate science, meteorology or any related field. But if it helps push people who have a direct interest in this data to dig deeper, more power to them. I work on these diagrams and charts like others work on a daily crossword puzzle. It just interests me.

Having said that, I think it’s fair to say the past few days have been historic and extraordinary in the Pacific Northwest, or at least at Seattle-Tacoma International.


Updates: 6/28, 8:10 AM:

  1. Corrected t-Depart values for 6/27 based on updated official data from NWS.

  2. Added Figure 1B for more detail and clarity of underlying data

Updates: 6/28, 3:15 PM:

  1. Added a histogram to the blog post.

  2. Renumbered Figure Nos. to reflect new chart.

Updates: 6/29, 7:00 AM:

  1. Updated all Figures (except for Figure 1B) with data from 6/28, Seattle’s hottest day in recorded history.

  2. Added Figure 1C.

Updates: 7/22, 9:30 AM

  1. Updated Figure 1 for data through July 21, 2021.

  2. Updated Figure 1C for data through July 21, 2021


Software tools:

  1. Datagraph 4.7.1 by Visual Data Tools, Inc. for macOS X for statistical charts.

  2. Microsoft Excel for macOS X for data aggregation, sorting, filtering and Pivot Table functions.


COPYRIGHTS

All datagraphics on this site © David Blackwell, Seattle, 2021. All rights reserved.
Please contact me using the form linked at left for permission to use.

A La Niña winter...

We’re in the midst of a La Nina winter in the Pacific Northwest and the weather is about as normal for a La Nina winter as one can expect. Generally, La Nina years are defined by periodic cooler sea temperatures in certain areas of the Pacific Ocean. But the effects from these cooler seas are characterized by cooler winter temperatures and more rainfall in the Pacific Northwest. Neither of these are guaranteed, but they are more likely to occur.

On temperatures, Figure 1 shows two charts. The upper chart shows the daily average temperature departures from the 30-year climatic normals at Seattle-Tacoma International Airport from 2000 to the present. The red bars (or really lines at this scale) reflect daily average temperatures which exceed the 30-year average for a particular day. The blue bars represent days where the average temperature was lower than the 30Y climatic average. The temperatures were taken and are published by the National Weather Service.

There’s a fit curve on both charts in Figure 1. The top fit curve is a 365 day smoothing curve of the daily temperature departure value. Interestingly, sometime around 2013, this average fit curve moved into the positive range and has remained above zero for about eight years now. There might be a variety of reasons for this, but we’ll save speculating and a more in-depth look for another day.

The second chart in Figure 1 shows the same data since October 1, 2020. This is unofficially the start of the water year in the Pacific Northwest, the time of year when rain storms blow in off the Pacific frequently and more consistently. It also roughly matches our ‘cold’ season.

For the most part, the cold season in Seattle continued to be a bit warmer than the 30-year average except for may to one-week cool period, one in October and one in November. But since the first of the year, we have been seeing a cooling trend, slight at first, but more pronounced beginning in late January. And this is a cooler-than-most-winters trend. There is a fit curve on this chart as well. This is what is called a LOESS fit curve of the data since October 1, 2020 and it shows the general near-term cooling trend late this winter after a warmer start.

They say the effects of La Nina years really kick in after January, and that appears to be the case this year when it comes to temperatures.

Figure 1. Temperature anomalies from 30-Year normals for the 2020-21 water year in Seattle, Washington.


Winter precipitation amounts tend to increase from long-term normals during La Nina years in the Pacific Northwest. The top chart of Figure 2 shows clearly this is a wetter than normal winter in Seattle. It also shows this is far from the wettest and that it hews closer to the normal than to the extreme winters.

The second chart in Figure 2 shows that most of the extra rain fell in a 5-6 week period beginning in early December and ending in mid-January. Roughly 2.5-3X the amount of rain fell daily during this period this winter than the eight weeks prior or six weeks following it. We’ve had a lot of cloudy days in February, and even a lot of snow – about 12 inches a few weeks ago. But the relative amount of water falling from the sky hasn’t been that much. And with both the warmer temperatures (Figure 1) and below-average rainfall we experienced in October and November, it seemed early on La Nina was initially going to be a bust.

We move into March next week, and April 1 represents the traditional ‘end’ of the wet season. It will be interesting to see if the more moderate rains continue and if the cooler-than-normal temperatures extend into early spring. I’ve seen a few daffodils and blooming trees already, but at least in my own yard and garden, things seem to be a little slow coming in this year. We often get an early start to spring beginning in February. I haven’t noticed that to be the case so much this year.

The water year precipitation charts might be difficult to read in this application. A zoomable version can be found here.

Figure 2. Accumulated precipitation for the 2020-21 water year start compared with past years and La Nina years.


Keywords:
litterrocks, blog, weather, climate, temperature, precipitation, Seattle, SeaTac, 2021


Data Sources:

Data Sources:

Data Graphics Software (unless indicated differently):
Visual Data Tools, Inc. DataGraph 4.6.1 for macOS.

Chart Design: © David Blackwell, Seattle, 2021. Please contact for permission to use: https://www.litterrocks.com/contact

a very dry summer...

Dry and smoky…

Smoke has settled in on most of the U.S. west coast in recent days. It seems unprecedented. It appears to have extended into Canada, and probably into Mexico as well. The cause is due to an extensive number of forest and grass fires, many of them caused by more severe than normal dry conditions and an extraordinary series of lightning storms in August.

I live in Seattle and the severe orange-tinted smoke that has been impacting much of California and Oregon in the past week or more hit Seattle Friday morning and has continued into the weekend. The smell of smoke is everywhere outside.

How dry has it been? Taking a look at SeaTac International Aiport weather records for summer precipitation (defined here as July-August-September) it has been extremely dry in 2020. Looking at the past 21 years, it appears only three other summers have been drier, 2006, 2017 and 2018 been drier through September 12.

Both 2017 and 2018 had similar periods of orangy skies in August or September, but I don’t recall them being quite as bad as today. I believe the smoke on any day in 2017 was less intense, but the smoke stuck around longer. The smoke of 2018 may have been the equal of this year.

There have been some other notably dry periods: 2000-2003 were almost as dry as 2020, but I don’t recall pollution quite like this year. Memories can fade though. The year 2006 was memorable to me as the endless summer. And it too may have been drier for longer than 2020. But it began raining on or around September 14.

Figure 1 is a series of multiple small charts each showing the precipitation patterns in Seattle from July 1 through September 30 for each year since 2000.. The last small chart for 2020 has data only through September 11.

Click onto any individual chart below to compare the selected year to others.


Figure 1. Small multiples of line comparison charts for each summer period between the years 2000-2020. Click onto any individual year to expand.


A closer comparison…

Figure 2 shows a magnification of the 2020 chart shown above. I’ve added some additional detail.

  • The cumulative rain totals for 2020 is shown in the blue line.

  • The equivalent lines for the three drier years: 2006, 2017 and 2018 have been annotated.

  • The red vertical line demarcates September 11 the point of comparison (and the date in 2020 when this chart was created – you can mentally move the line one day to the right as it did not rain on 9/12/20 either).

As you can see, the summer of 2017 was extraordinarily dry. Rain was essentially non-existent. The same can almost be said of the summer of 2006 for the period of record we are comparing.

Also note that in 2006 and 2018, rains returned beginning on September 13. Rains returned in 2017 on September 16, ending the drought.

Figure 2. Zoom-in of the year 2020 chart showing comparisons to wetter summers.


Figure 3 is simply an animation that loops through the years in numerical order. The animation will loop through three full cycles before stopping. Refresh the web page if the animation has auto-stopped. What this shows is the precipitation variance between years though the 20-year August-September period. There does not appear to be any apparent trend using this visualization technique.

Figure 3. Period precipitation animation.

Figure 3. Period precipitation animation.


Driest to wettest summers in order…

The line charts above are ordered by calendar year. Figure 4 shows the same years ordered by driest to wettest summers for the period from July 1 to September 11 for each year.

The figure below contains a strip plot. It shows the cumulative amount of precipitation in Seattle (SeaTac International Airport) for the summers from 2000 to 2020. It is a form of a distribution chart. All years from 2000-2020 are included, but not all are labeled for clarity purposes.

This year, 2020, has not been the driest year during this period, but it is the fourth driest on the list. Both 2017 and 2018 were drier and we experienced smoky periods in both summers, though I’d say the smoke in 2017 was not as bad as in 2018 or 2020. That’s just a personal perspective based on three-year old memories. Looking back at old photos, from a human-experience perspective, I’d say the smoke of the summers of 2018 and 2020 was roughly the same, though a scientific measure of smoke particulate levels might say otherwise.

I do remember thinking of 2006, another very dry summer, as the Endless Summer. And it was through September. Ironically, the following November, beginning less than two months later, was one of the wettest months in Seattle’s history.

Figure 4. Strip plot of summer rain totals (July 1 thru Sept 11) for the years 2000 through 2020, Seattle.


Some smoky scenes from the summers of 2017 and 2018, Seattle:

Images from 2017. Click on any to enlarge.


Images from 2018. Click on any to enlarge.


ALL CHARTS DESIGNED USING VISUAL DATA TOOLS DATAGRAPH 4.5.1 SOFTWARE.
DATA IS FROM THE NATIONAL OCEANIC AND ATMOSPHERIC ADMINISTRATION (NOAA) AND THE NATIONAL WEATHER SERVICE (NWS). VISIT https://www.weather.gov/sew/ FOR MORE INFORMATION.

CHART DESIGNS: © litterrocks.com. ALL RIGHTS RESERVED. Please contact litterrocks via the ‘Contact’ link on this page for permission to use.

LAST UPDATED: September 13, 2020.

An especially dark and dreary winter...

This has been an extraordinary dark and dreary winter in Seattle. A dotplot of the cumulative daily Sky Cover scores for SeaTac International Airport shows the period between December 1, 2019 though January 29, 2020 far exceeds the scores for similar periods back to 2006-07.


Another way to view the darkness this winter is to look at the average daily solar radiation, measured in MJ/m^2. This data is available from Washington State University.

Extracting data from their ‘Seattle’ location – which I beleive is on the campus of the University of Washington, but subject to correction – you can see that the average daily solar radiation for this winter (December 2019-January 2020) is the lowest value for the past nine years, years in which data is available for this location.


Click to enlarge…


Finally, look at the rain pattern over this same December-January period this water year (a water year calendar runs from Oct 1 thru Sep 30 due to rain patterns in the Pacific Northwest). The line chart below shows that as of January 29, SeaTac International Airport has accumulated almost the exact normal amount of precipitation to be expected based on the 30-year average for this location (established from records for the 1981-2010 period).

But this year, the first 2-½ months of the water year were relatively dry. It wasn’t until about mid-December when the rains began catching up to the 30-year average. It’s taken a lot of steady dark, water-heavy clouds to drop this amount of rain in a relatively short period. This information supports the high level of daily cloudiness and low level of solar radiation shown in the first two charts.

Click to enlarge.

A warm and dry summer

Just a few graphics to revisit and see where we stand with temperatures and precipitation totals for Seattle Washington in 2016-17.

Temperatures

Seattle's 2017 summer began very pleasantly. It began early, around mid-May. June and July were extremely pleasant, with sunny skies nearly every day and temperatures in the mid-70s. But when the calendar flipped over to August, a smoky heat wave rolled into the region. Combined with a very dry past three months, the region feels hot and tinder dry currently.

Click to enlarge.

Precipitation

Like last year, the year began very wet. In fact, using the water year calendar which begins on October 1, Seattle had nearly 13 inches more rain than a typical water year by early May. This exceeded 2016's huge totals on that date. 

But, around May 16, the spigot was shut off. And aside from one drenching, winter-like day in mid-June, the region has been very dry.

Click to enlarge.

A winter to forget...

The past year (and then some)

This is my final post on this cold snap / winter topic. First, I think the weather is changing and winter really is exiting. Second, as a subject, it has become a little tired. So, here goes. 

I suspect the extended coolish pattern we’ve experienced over the past three months has finally had its run. I’m not a meteorologist nor a climate scientist. Just someone working on my writing and data presentation skills. It just seems that we’re approaching the end of a pattern. The longer term forecasts seem to point towards more normal temperatures.

No doubt, we will still get cooler-than-normal days. Just as we’ll get warmer-than-normal days. But I think the persistent patterns are breaking down. Looking at those cooler-than-normal patterns on the right of Figure 1 shows that up until about March 9, we were still seeing strings of continuous cool days. However, the last few days have been mild, and the temperature deficits have been shrinking since about early January.

A couple of things seem clear from Figure 1

  • This coldish spell was persistent and long — almost 3-½ months long (with a few brief interruptions);
  • it was preceded by at least 11 months of predominantly warmer-than-normal weather; and
  • the change from one state to the other was quite abrupt in early December. It was as though a switch was flipped.

Figure 1. Temperature departures for the past 15 months. Click to enlarge.

****

Temperature Deviations - A longer comparison (2000-2017)

Figure 2 shows similar temperature deviation data to Figure 1, except it covers a much longer stretch of time backwards. The red zones depict the approximate stretch of winter (Dec-Feb) for each annual period.

I mentioned in the section above that prior to the recent three month cold snap, Seattle experienced 11 months of warmer-than-normal temperatures. Well, looking at a longer timescale backwards, the stretch of warmer weather goes back at least about three years, aside from occasional brief spikes of temperatures in the opposite direction.

For most of this period, specifically the dozen or so years extending from 2000 through 2012, the daily differences from normal temp appear to be more evenly distributed between short warmer and cooler periods. The year 2011 appears to have a long stretch of cooler temperatures — more in the early spring-to-fall time frame rather than winter. And the two year period of 2003-04 appeared warmer than normal in winter as well. I recall during this time thinking to myself that after 20 years, I was finally becoming accustomed to cool, rainy Northwest winters and they weren’t as bad as they previously seemed to me. It turns out, I may had just been experiencing a milder series of back-to-back winters.

Figure 2. Comparison of temperature deviations over time (2000-2017). Click to enlarge.

****

What about the rain

The temperature discussion above focuses on the traditional winter months of December through February. In Seattle, our average winter day temperatures don’t differ much than late fall or early spring temperatures. We have mild winters, mostly and coolish springs. In fact, I’ve always considered the period between mid-October to mid-April as one long winterspring season. This time period nearly coincides with the first half of the west coast meteorological water year which typically runs from October 1 to September 30 each year. Seattle, and much of the northern West Coast has a wet season and a dry season. So I’ll use the Oct-Sep water year as a time period to discuss this winter in terms of precipitation.

Figure 3 shows the accumulated precipitation since the beginning of the water year. This year’s line is the blue dashed line. The orange line represents the climatic averages from the years 1981-2010 from SeaTac International Airport. Clearly, we are experiencing a very wet rainy season. So far — and the rainy season for this year is not over  — we have had about 11 more inches of rain than normal since October 1 of last year.

Figure 3. Cumulative precipitation since October 1, present year and historical. Click to enlarge.

So we're having an extraordinarily wet year. Big deal — some years are wet; some are dry. However, are these wet years becoming more frequent? I don't know if we have enough data to establish this claim for the long run, but recent years seem to be.

Figure 4 shows more recent years in the same chart as Figure 3. Last year, the 2015-16 water year, is the heavy black line. Last year was also an exceptionally moist year, the wettest of the previous 14 years shown. The medium gray lines reflect the water years: 2014-15; 2013-14; 2012-13 and 2011-12, the years precluded from the 1981-2010 average. The light grey lines represent the nine preceding years before 2011-12 since I have the data handy and they give some balance to the discussion.

The chart in Figure 4 illustrates:

  • Though it has been very wet since October and we are approach last year’s surge of rain, it is unlikely we will catch it. We are currently about 5 inches behind and are slowly approaching our drier months. Back-to-back years of this flow of water lends understanding as to why many are griping about this winter;
  • This year’s totals are in a tight race for second place of the wettest years of the past 15 years. Today, we are about even with 2006-07, which produced a notably wet start to winter [1];
  • Of the six (6) years since the 1981-2010 climate reference period, three are near the reference average and three are well above it (assuming the 2016/17 water year keeps accumulating precipitation at even the climatic average rate). Simply put, in an annual accounting of rain, we have been in a pretty wet period since 2010.

Figure 4. Cumulative precipitation based on the water year calendar, multi-years. Click to enlarge

So, what happens if you take the averages of the most recent past six water years, not included in the climatic data range, and compare them to the historical averages. Keep in mind that the 2016/17 water year is not even half way completed. This is shown in Figure 5. There has been a significant bump in the amount of precipitation we've seen recently. From the chart, it appears most of this bump has occurred in the months of October, February and March. September also shows an uptick in precipitation as well, but not as pronounced as those three. One could also make the case that summers are slightly drier (seen by the flattening of the blue curve in comparison to the orange one for these months).

Figure 5. Comparing the past six years to the climatic average. Click to enlarge.


Seattle has received over 246 inches of rain since October 1, 2011. Climatically, Seattle would be projected to receives about 214 inches of rain during this period. We've received nearly 34 inches of additional rain in the past six years. Table 1 illustrates this clearly.

This is almost an entire year's worth of additional rain squeezed in those six years. Much of that additional precipitation has occurred in the past two years.

Actually, it is worse than that. I included 2011-12 in Table 1 since it is not included in the 1981-2010 historical averages. I wanted to include all recent years not included in the historical average in an exploration to see where the data took me. 

Since Table 1 shows the 2011-12 water year to match essentially the historical average for the period, you can leave that year out of the discussion. Our near additional year of rain has been squeezed into the past five years. And — again — this water year is not half over yet.

In this context, one may like the rain but should also understand the weariness people are experiencing and the accompanying complaints.

****

Shades of gray

Aside from rain, the most common characteristic of Seattle winters (and wintersprings) is the near constant cloud cover. So, how did we stack up with regards to cloud cover? I’ll use the first half period of the water year for the time scale, since this is traditionally when the clouds roll in.

We began the water year with one of our rainiest Octobers. This was followed by a normal November, typically our rainiest month. So that in itself a sign that it might be shaping up for a pretty dismal winter. However, if you look at Figure 3, the rains softened in December. This can be seen by looking at the slope of the blue curve in December. Further, the last half of January saw little rain. In fact, December and January were cold, but not too rainy. If the skies were not completely clear, we experienced some sun during those months. More than usual, I’m guessing, without looking deep into the data. 

The rains returned in February at an accelerated rate. February 2017 was one of our wettest Februarys. The month of March, to date, has been dismal as well.

The National Weather Service gives a rating for sky cover for each day based on an 11-point scale, going from 0-10. In maybe an oversimplification, a day rated 0 is clear with no clouds. A day rating of 10 has 100% cloud cover. We can sum the scores for each day since October to see how this year compares to other years.

Figure 6 shows this. So far, this water year has been cloudier than all of the previous 10 annual periods except for one. But, with this chart it doesn't appear to be much.

Figure 6. Seattle Cumulative Sky Cover ratings, 2016-17 water year. Click to enlarge.

Figure 7 illustrates this method of comparison with a close-up of the data shown in Figure 4. So far, through March 10, SeaTac Airport has accumulated about 50 more sky cover points than the average for previous 10 years. These additional sky points don't buy you an upgrade; only a slight downgrade, unless you love clouds.

However, spread evenly, 50 sky points divide by 161 days (Oct 1 to Mar 10) account for only about .3 sky points per day. Or, another way of thinking things, the maximum sky cover points any day can have is 10. Divide 50 sky points by 10 points per really cloudy day and we have had roughly 5 extra really cloudy days more than average during this time period.

Figure 7. Cumulative Sky Cover rating points for annual periods running from October 1 through September 30. Click to enlarge.

A simpler way of observing the cloudiness of the past 5-½ months is to look at the total number of cloudy days in a table and compare this year’s numbers to past years. Table 2 shows  this comparison. 

To date, Seattle had about a 68% chance of seeing an all cloudy day this past wet season. Normally, in recent years, this would be a 64% chance. This winter, Seattle also had about an 8% chance of seeing a pretty clear day. In the recent past, we would have a 12.5% chance of seeing a reasonably clear day. The chances of a partly cloudy day are essentially the same for this year and the recent past.

So, yeah. It’s been a bit cloudier than normal; though not that much more. Still, every little bit adds up.


****

Final thoughts...

Yeah, this winter in the Pacific Northwest has been pretty dismal. More dismal than normal. More dismal than most. The coldish streak was a bit long — I grew very weary of it. But the low temperatures were not that cold. Consider the Midwest or Northeast in any normal winter. Our coolish winter temperatures this year were still pretty moderate in comparison.

We had snow a couple of times. Deep enough for some fun and some nice photos. Not too much to cause trouble for commuting in the lowlands, though the mountain passes got hit hard at times.

This area doesn’t seem to suffer too often from daily extreme temperatures, humidities, or even heavy rains. We get strong winds blown in off the North Pacific occasionally, but we don’t see hurricanes or tornados often. 

Where we see extremes, it seems to me, is that we settle into long, long patterns, whether long heat streaks; long coldish streaks, long rainy streaks, and — for me the most dreaded — endless cloudy stretches. 

This winter combined most of those long streaks. I’m happy to see it ending and am looking forward to longer days, brighter skies and warmer temperatures. 

****

References:
[1] City That Takes Rain in Stride Puts on Hip Boots; Yardley, Wm.; New York Times; November 27, 2006.
[2] Data Sources NOAA NWS Seattle Local Climate site (click on text for link).

Charts and Graphics Notes:
Data from NOAA/NWS Climate site was post-processed in Microsoft Excel for Mac 2016.

Figures 1-7 were produced using DataGraph 4.2.1 software from Visual Data Tools, Inc. and available on the Apple App Store. A terrific product that keeps improving — support good engineering and design.

Base charts were copied to Adobe Illustrator CS6 for post process refinement and scaling.

Tables 1 and 2 were developed in Adobe InDesign CS6.


The cold return...

In mid-February there was some small hope that we’d break out of this coldish streak we’ve encountered in Seattle since early December. It turns out this was wishful thinking. There were maybe a week’s worth of slightly warmer-than-normal days to enjoy, but these were accompanied with some heavy rains as well. For a week now, we’ve flipped back to a cooler-than-normal situation. The long-term forecast is much of the same continuing through March. It’s not really that cold; it’s above freezing. But I think a lot of us are looking forward to some more springlike temperatures. I’m pretty sure the plants are.

Daily departures from 30-year normals.
Click to enlarge.

As I mentioned, we had some heavy rains the first half of February. These nearly matched the heavy rains of last October, before we hit a relatively normal-to-dry period from November through January. For a brief period, it appeared we might catch up with last year’s very wet winter. But the rains seem to have taken a pause now that the cold weather has returned.

Onto March…

Click to enlarge.

A warm, wet storm arrives. Is this a turn towards spring?

Early this morning, about 3:30 A.M. a pounding, wet rainstorm woke me up. I sleep beneath a skylight, and though it has yet to leak on me in 17 years, I suspect one day it will. It is in a skylight’s nature to do so. This squall came after an all day rainy Wednesday.

The seasonal water year begins on October 1 in Seattle and runs through the next September 30 for any given period. This year’s water year began exceptionally wet starting about mid-October. Storm after wet storm blew in. But in December — a normally wet month — we seemed to get a reprieve. January was similar except for perhaps a few rainy, individual days.

February seems to have picked up where October left off. We started with snow, but it’s been the strong storms the past few weeks which have really added to the precipitation totals. 

They say more is on the way later this weekend. If true, we may catch up with last year’s very wet winter. But, even with these heavy rains, that would be a tall order.


Cumulative Precipitation for Several Seattle Water Years. Seattle is known for rain. But mostly our rains come in the winter half of the year. Therefore, a local meteorological measure of time is the water year, which runs in our region from Oct 1 through Sep 30. The chart above tracks the cumulative amount of this year's water precipitation (blue, dashed line).

The most recent five water year tracks are illustrated in black, with last year's water year track in shown as the heavy black line. The remaining gray tracks are water years for the 2002-03 through 2011-12 seasons.

Click to enlarge.


****

The recent rains have been warm. This is shown on the far right end of the chart below. Spring often hits Seattle in late February, with our relatively mild Pacific climate. Maybe the cold snap we recently experienced (highlighted on the chart) is over for good and we’re moving into spring. The daylight sure is stronger and richer.

I hope this is true, but it's too early to tell.


Daily Temperature Departures from 30-year (1981-2010) Averages. A significant change occurred in the early part of December where a lengthy, relative warm year switched to a cold period for about two months.

Click to enlarge.

Continued cold...

Our coldish winter in the Pacific Northwest continues. About halfway through winter, cooler days than normal days are the dominant pattern. Here in Seattle we received about four inches of snow on Monday. It's not a large amount, even for here, but it is the first significant snowfall we've had in five years.

Starting a few days into December, the mean daily temperatures switched abruptly from warmer than normal for most of 2016 to cooler than normal. Aside from a few days, it has remained consistently cool.

Click on to enlarge.

A wintry white scene in Seattle's Volunteer Park on February 6, 2017.