Dry and smoky…
Smoke has settled in on most of the U.S. west coast in recent days. It seems unprecedented. It appears to have extended into Canada, and probably into Mexico as well. The cause is due to an extensive number of forest and grass fires, many of them caused by more severe than normal dry conditions and an extraordinary series of lightning storms in August.
I live in Seattle and the severe orange-tinted smoke that has been impacting much of California and Oregon in the past week or more hit Seattle Friday morning and has continued into the weekend. The smell of smoke is everywhere outside.
How dry has it been? Taking a look at SeaTac International Aiport weather records for summer precipitation (defined here as July-August-September) it has been extremely dry in 2020. Looking at the past 21 years, it appears only three other summers have been drier, 2006, 2017 and 2018 been drier through September 12.
Both 2017 and 2018 had similar periods of orangy skies in August or September, but I don’t recall them being quite as bad as today. I believe the smoke on any day in 2017 was less intense, but the smoke stuck around longer. The smoke of 2018 may have been the equal of this year.
There have been some other notably dry periods: 2000-2003 were almost as dry as 2020, but I don’t recall pollution quite like this year. Memories can fade though. The year 2006 was memorable to me as the endless summer. And it too may have been drier for longer than 2020. But it began raining on or around September 14.
Figure 1 is a series of multiple small charts each showing the precipitation patterns in Seattle from July 1 through September 30 for each year since 2000.. The last small chart for 2020 has data only through September 11.
Click onto any individual chart below to compare the selected year to others.


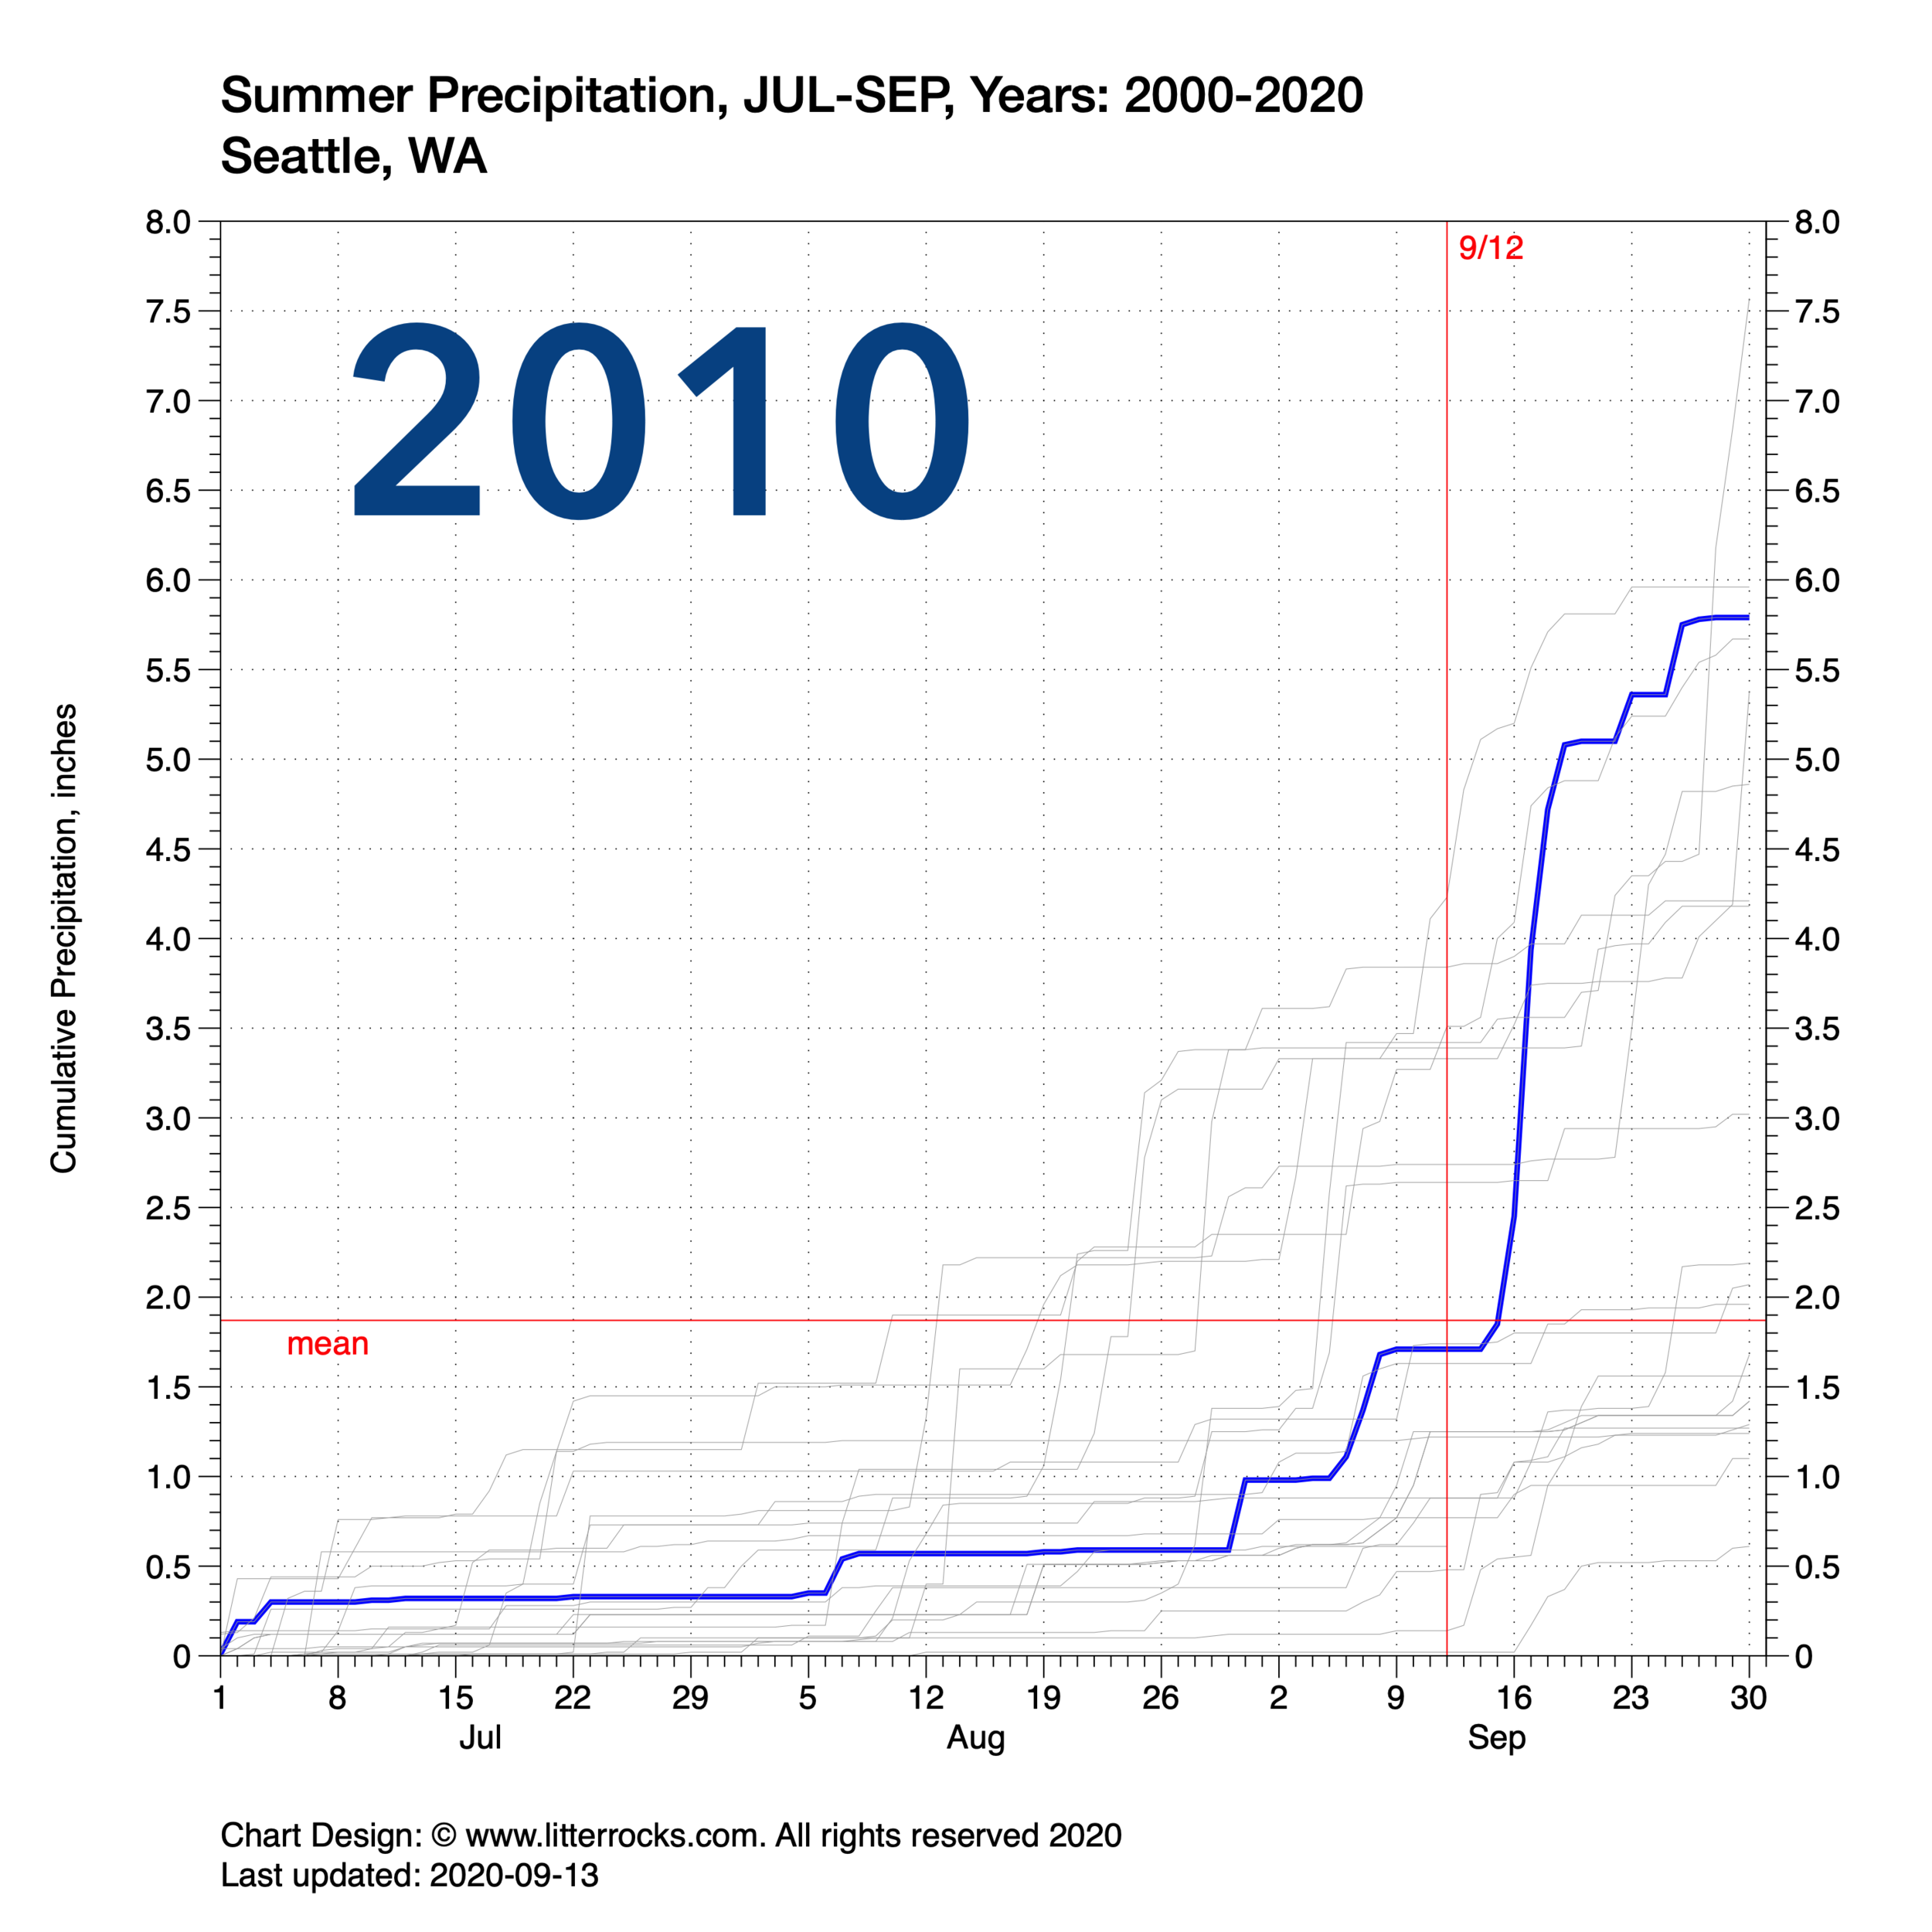


Figure 1. Small multiples of line comparison charts for each summer period between the years 2000-2020. Click onto any individual year to expand.
A closer comparison…
Figure 2 shows a magnification of the 2020 chart shown above. I’ve added some additional detail.
The cumulative rain totals for 2020 is shown in the blue line.
The equivalent lines for the three drier years: 2006, 2017 and 2018 have been annotated.
The red vertical line demarcates September 11 the point of comparison (and the date in 2020 when this chart was created – you can mentally move the line one day to the right as it did not rain on 9/12/20 either).
As you can see, the summer of 2017 was extraordinarily dry. Rain was essentially non-existent. The same can almost be said of the summer of 2006 for the period of record we are comparing.
Also note that in 2006 and 2018, rains returned beginning on September 13. Rains returned in 2017 on September 16, ending the drought.
Figure 2. Zoom-in of the year 2020 chart showing comparisons to wetter summers.
Figure 3 is simply an animation that loops through the years in numerical order. The animation will loop through three full cycles before stopping. Refresh the web page if the animation has auto-stopped. What this shows is the precipitation variance between years though the 20-year August-September period. There does not appear to be any apparent trend using this visualization technique.

Figure 3. Period precipitation animation.
Driest to wettest summers in order…
The line charts above are ordered by calendar year. Figure 4 shows the same years ordered by driest to wettest summers for the period from July 1 to September 11 for each year.
The figure below contains a strip plot. It shows the cumulative amount of precipitation in Seattle (SeaTac International Airport) for the summers from 2000 to 2020. It is a form of a distribution chart. All years from 2000-2020 are included, but not all are labeled for clarity purposes.
This year, 2020, has not been the driest year during this period, but it is the fourth driest on the list. Both 2017 and 2018 were drier and we experienced smoky periods in both summers, though I’d say the smoke in 2017 was not as bad as in 2018 or 2020. That’s just a personal perspective based on three-year old memories. Looking back at old photos, from a human-experience perspective, I’d say the smoke of the summers of 2018 and 2020 was roughly the same, though a scientific measure of smoke particulate levels might say otherwise.
I do remember thinking of 2006, another very dry summer, as the Endless Summer. And it was through September. Ironically, the following November, beginning less than two months later, was one of the wettest months in Seattle’s history.
Figure 4. Strip plot of summer rain totals (July 1 thru Sept 11) for the years 2000 through 2020, Seattle.
Some smoky scenes from the summers of 2017 and 2018, Seattle:

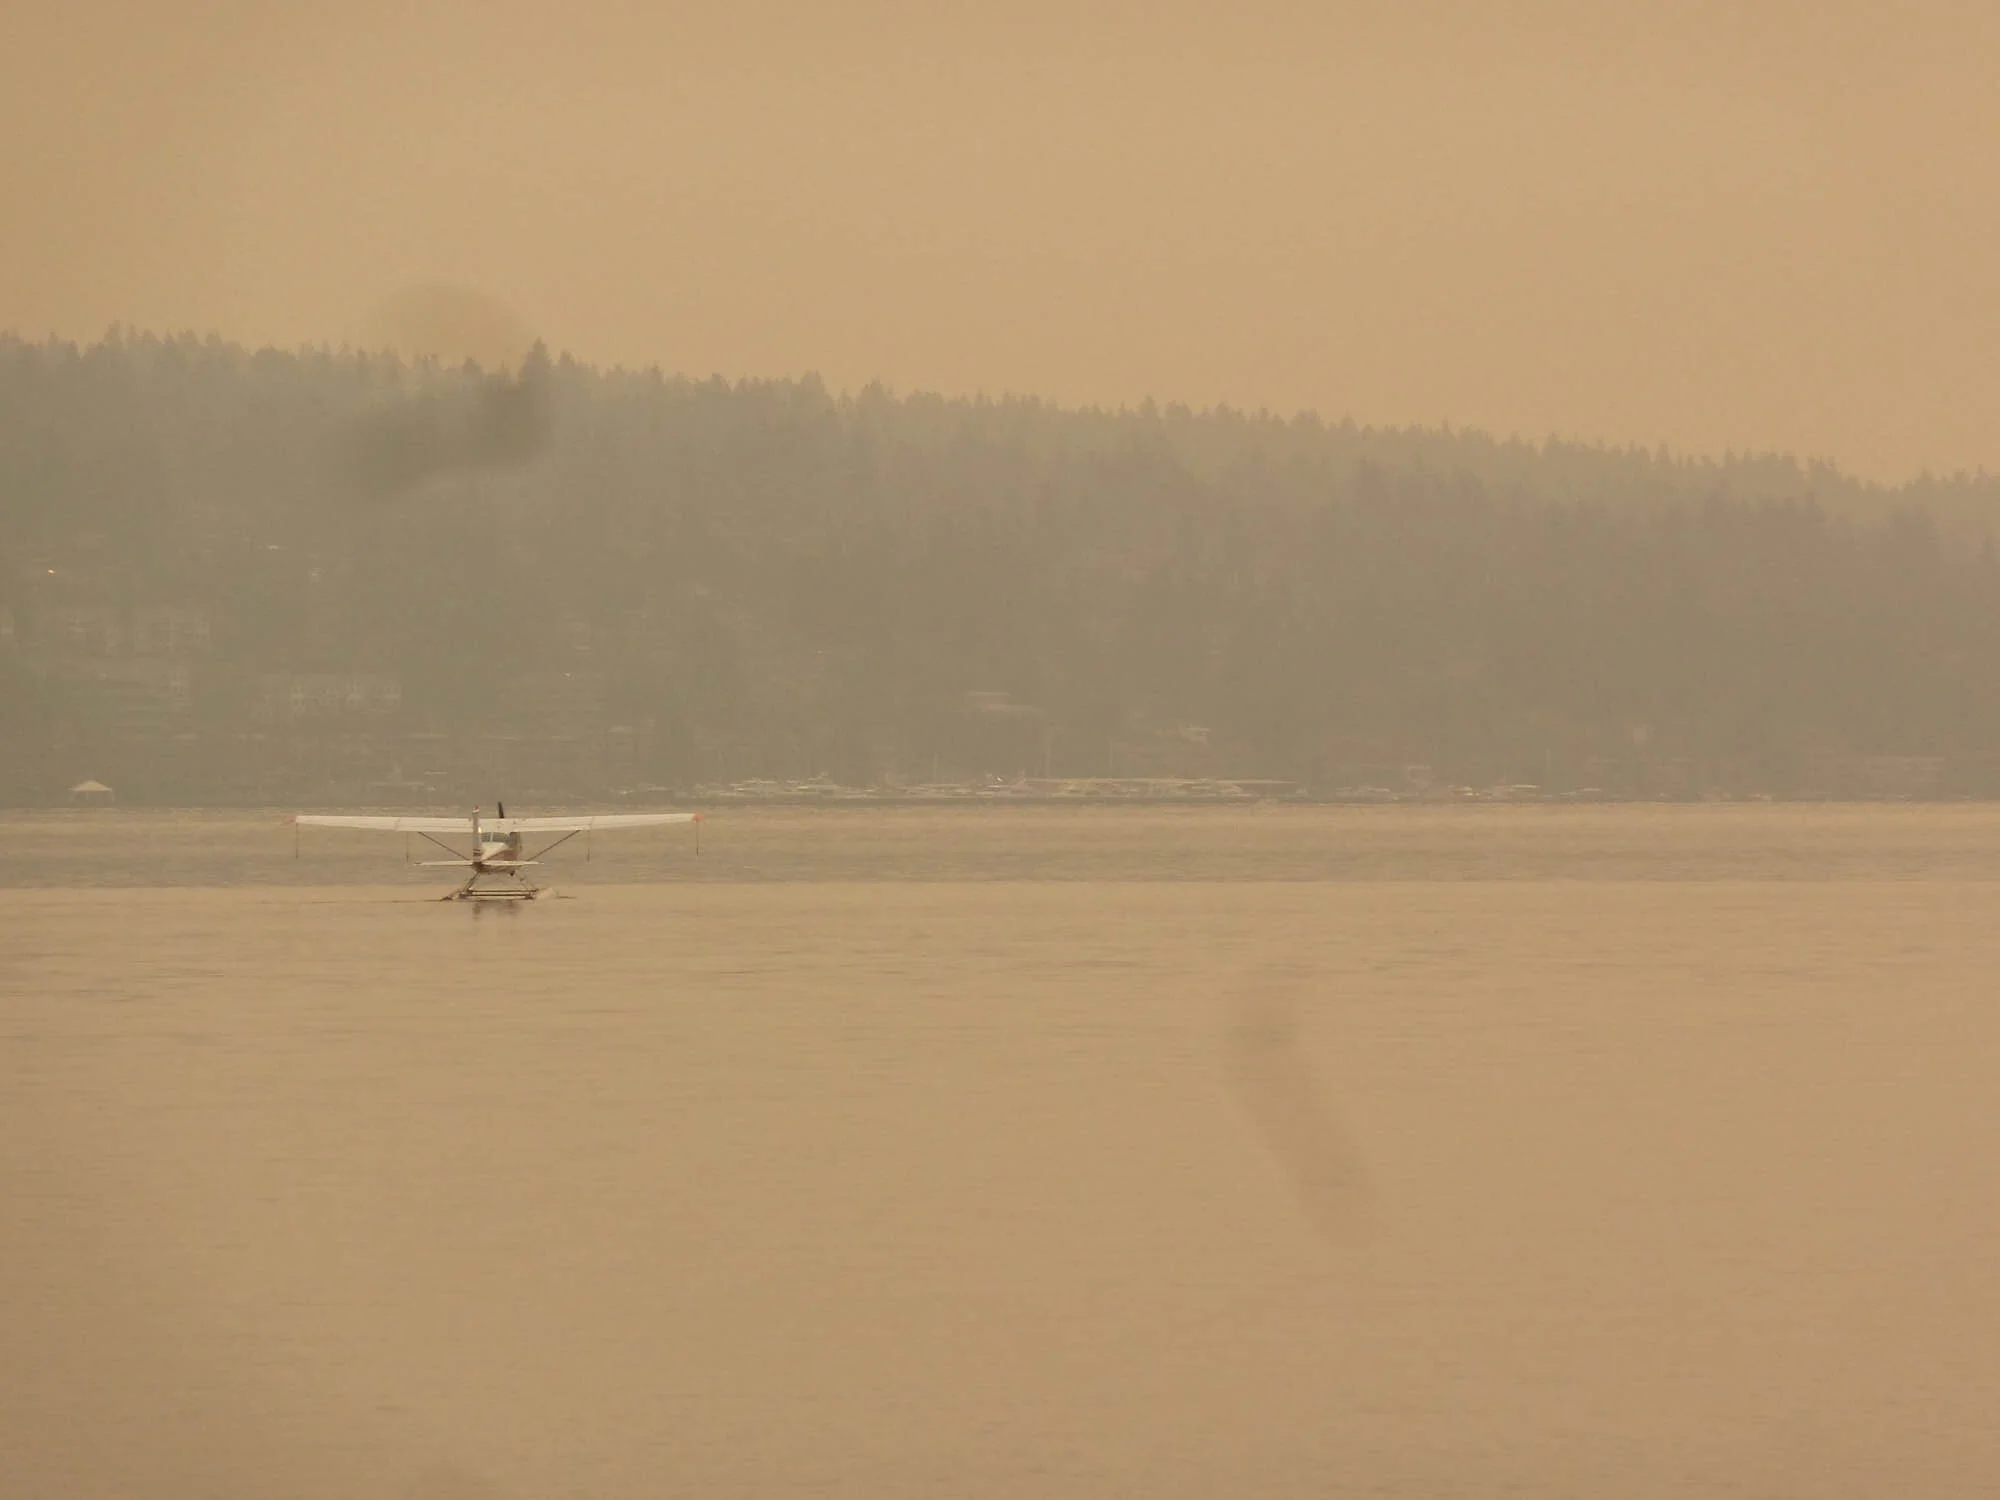


Images from 2017. Click on any to enlarge.


Images from 2018. Click on any to enlarge.
ALL CHARTS DESIGNED USING VISUAL DATA TOOLS DATAGRAPH 4.5.1 SOFTWARE.
DATA IS FROM THE NATIONAL OCEANIC AND ATMOSPHERIC ADMINISTRATION (NOAA) AND THE NATIONAL WEATHER SERVICE (NWS). VISIT https://www.weather.gov/sew/ FOR MORE INFORMATION.
CHART DESIGNS: © litterrocks.com. ALL RIGHTS RESERVED. Please contact litterrocks via the ‘Contact’ link on this page for permission to use.
LAST UPDATED: September 13, 2020.