
Fully Vaccinated per Hundred Population, Select Countries
February 23, 2022
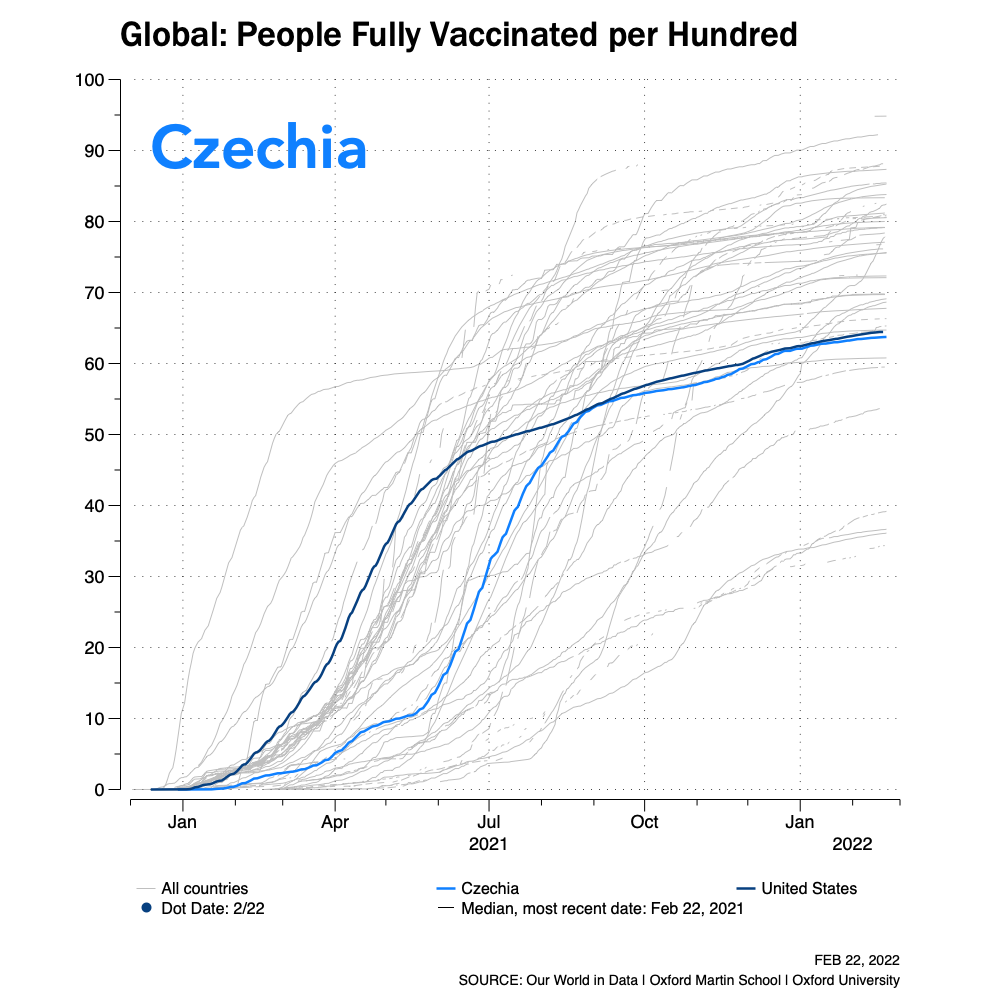
Data thru February 22, 2022, unless otherwise noted on chart.
A limited number of trend charts for fully vaccinated people for COVID by country are shown below. Each chart also includes a plot of an olive green line for a single country and a reference blue line for similar data for the U.S. This is an initial publishing of these charts. There are too many countries to publish all charts. The plotted gray lines represent all countries for which data exists, which is most.
Countries showing no trendline likely have not reported data.
Updates to this page and the countries displayed will likely occur over the new few days. Dotted lines indicate data is reported sporadically.


DATA SOURCE:
Data for these visualizations and charts was downloaded and used from Our World in Data (OWID) and is used under a Creative Common CC-BY license granted by OWID.