
Global – Exploratory Data Analysis: Deaths, New Cases, and Vaccinations
March 5, 2022
Data thru: March 2, 2022.*
Global data updates for approximately 20% of the countries shown here lag by approximately one week from current date. Therefore, the data date shown is used to accomodate most countries in the charts.
***
The first dot plot basically shows the percentage of each country’s population fully vaccinated against COVID-19. It is a select list of countries. Some countries targeted for plotting do not currently show data for the publish date in Oxford University’s Our World in Data csv file which is published daily. Therefore the data date often lags by 3-4 days to how a more complete set of countries.
In addition to the vaccination dot plot, the other dot plots show, in order:
At least one vaccination shot per hundred;
New Cases per Million;
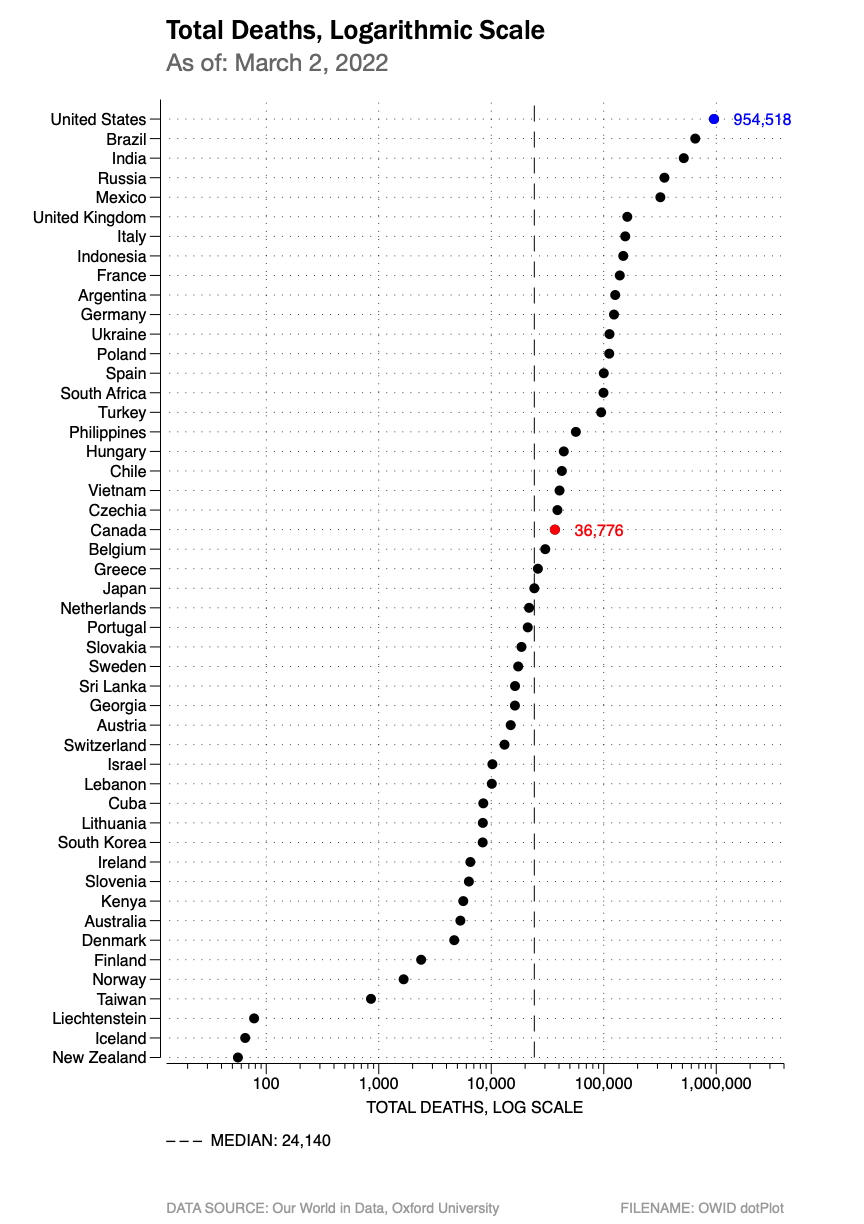
Total Deaths due to COVID;
COVID Deaths as a percent of population;
the median age of the shown countries; and
the estimated current population of each shown country.
Several charts highlight and compare data for the United States and Canada.
..
On the bottom of the page is a box plot of COVID deaths as a percentage of a county’s population. A box plot shows a distribution of the values in a data population.
More information on box plots is available here.


The following data distribution box plots show where the United States stands relative to peer countries for various COVID vaccination, case rate and mortality statistics.


DATA SOURCES: This COVID-related data is provided by Oxford University’s Our World in Data database and used in accordance with a Creative Commons CC BY 4.0 License.