
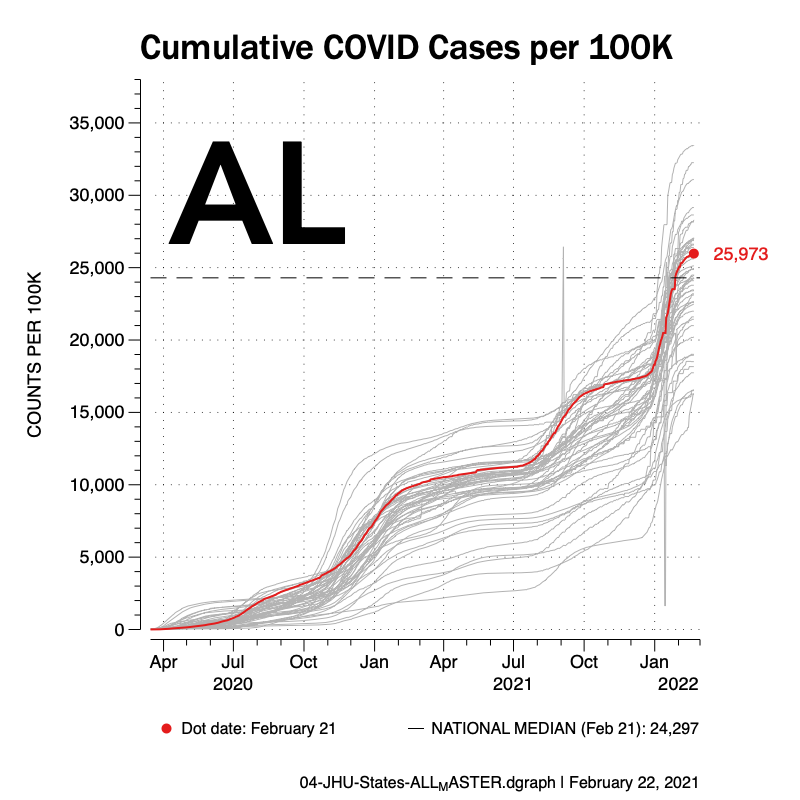
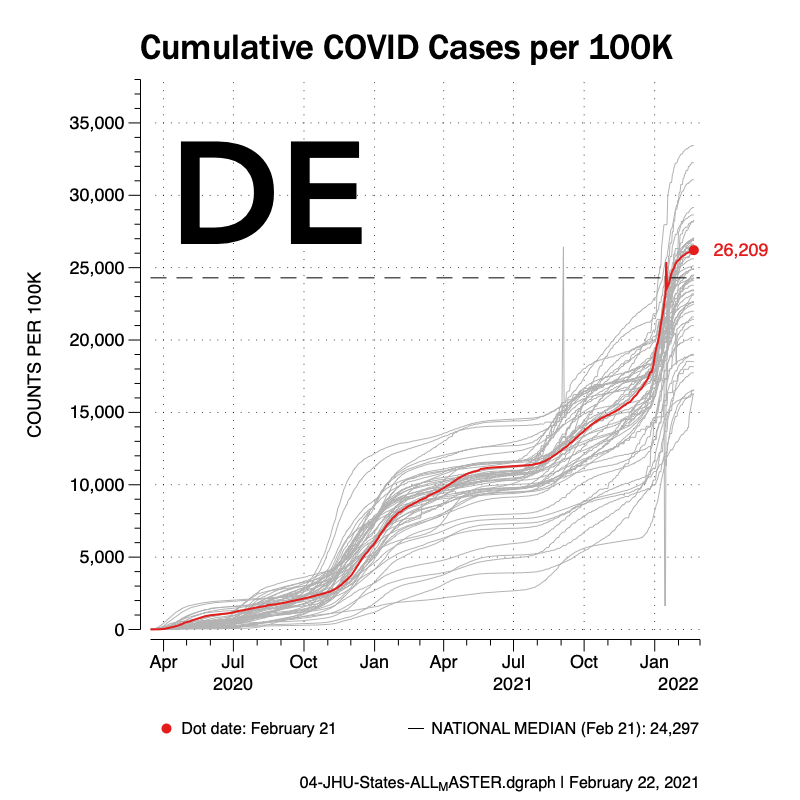
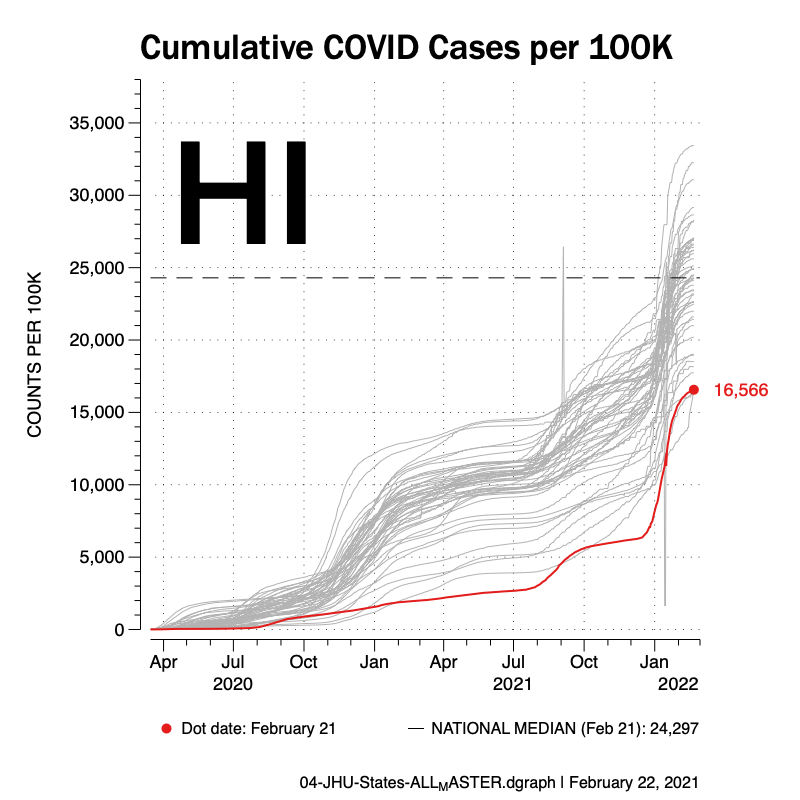
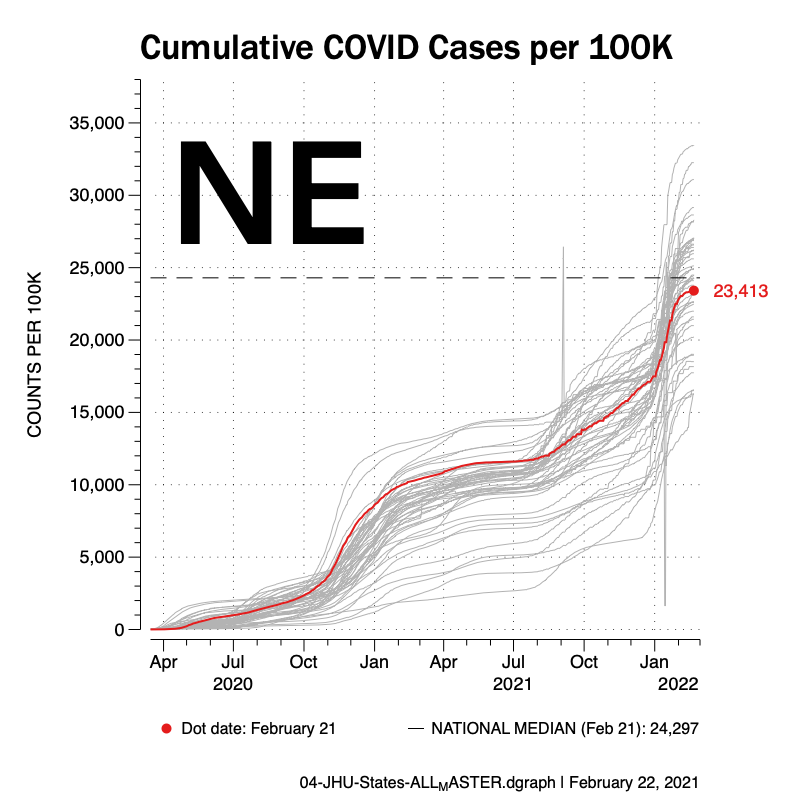
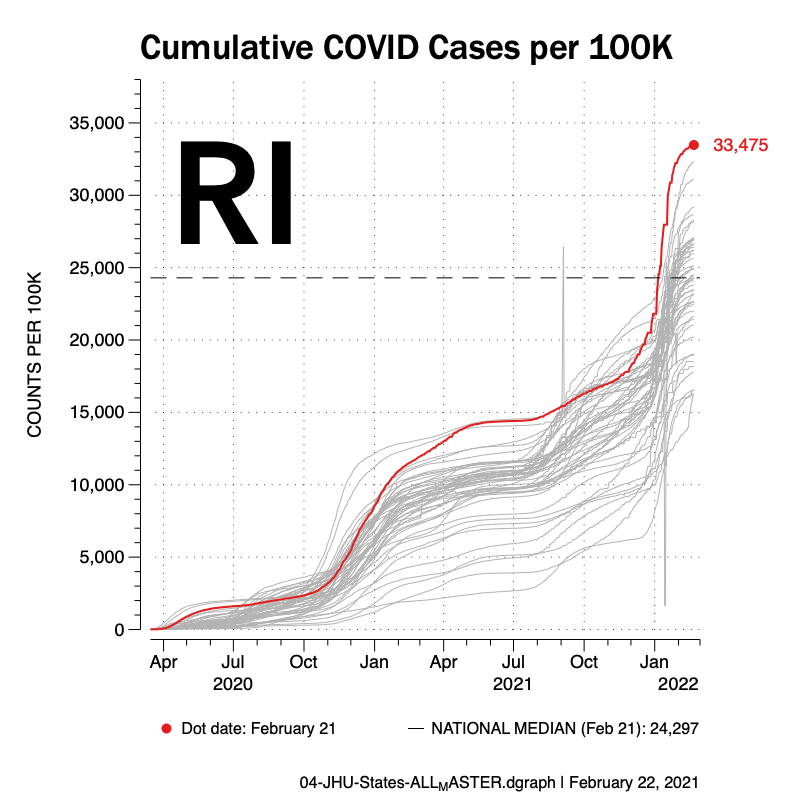
States: Cumulative Cases per Capita (100K population)
February 22, 2022
Data thru February 21, 2022, unless otherwise noted on chart.
Return to the Covid Index page.
The following charts show the cumulative number of COVID-19 cases per capita (100K population) over time for each state and the District of Columbia. The state names are initialized and are presented in alphabetical order.
Click on any individual chart to expand it.


keywords: covid, COVID19, positive, testing, cumulative, states, u.s., united states,
DATA SOURCES:
The COVID data is provided by John Hopkins University (JHU) School of Medicine and used in accordance with a Creative Commons CC BY 4.0 License.
Prior to JHU, the COVID data was provided by the COVID Tracking Project (CTP) at The Atlantic and used in accordance with a Creative Commons CC BY 4.0 License. The CTP ceased updating data on March 7, 2021. Further updates were continued by JHU.